
You open a post, note its impressions, then return to the wider analytics view. The totals don’t seem to agree. Before you decide something is broken, check what each screen is counting.
A number can be accurate for its own scope and still be the wrong number to compare. A date filter might select posts rather than limit their results. A total might cover several pieces of content. A blank field might mean the metric doesn’t apply.
This guide is for members reviewing their own content analytics. It isn’t a guide to company Page reporting or advertising attribution. We checked LinkedIn’s official documentation on 14 November 2026; screen placement can vary as features roll out.
Quick answer
Start with the metric name, reporting scope and cutoff time. LinkedIn’s recent-posts table uses lifetime totals for each post, while its content-performance graph reports activity within the selected period. Changing the table’s date range selects posts created in that range; it doesn’t turn their lifetime results into period-only results.
That documented difference can explain a mismatch without a technical fault. If the screens still disagree after you align their scope, save the details and investigate that specific discrepancy.
Key takeaways
- Write down exactly what each number describes before doing arithmetic.
- Separate a post’s publication date from the dates when it received activity.
- Compare the same metric; impressions and distinct members reached answer different questions.
- Treat unavailable data as unavailable, rather than silently entering zero.
- Record your observation time so an older screenshot isn’t mistaken for a current total.
A simple framework: label, scope, time
Think of an analytics number as a sentence with missing words. “This post received…” needs a metric, a period and a definition before it tells you anything useful.
Make the sentence complete in your notes. For example: “This is the lifetime impression total displayed for this individual post when I checked it this morning.” That is much clearer than “LinkedIn says 800.” The number in that sentence is an explicitly hypothetical illustration, not a benchmark.
Then write an equally precise sentence for the other screen. If one says “all content during the selected week” and the other says “this post over its lifetime,” you’ve found a comparison problem before you’ve found a platform problem.
Use this small diagnostic table to decide where to look next.
| What looks wrong | First check | What not to conclude yet |
|---|---|---|
| A post total exceeds a weekly total | Lifetime versus selected-period scope | That one screen has lost data |
| Changing dates leaves a row’s count unchanged | Whether dates select posts by creation time | That the filter failed |
| Impressions exceed members reached | Repeat displays versus distinct audience | That every display was a new person |
| A metric shows a dash | Whether that metric applies to the format | That its value is zero |
| Today’s activity is missing from a graph | The documented reporting cutoff | That the post stopped receiving attention |
| Audience details are missing | Privacy and audience restrictions | That nobody saw the content |
1. Check whether the date filter changes the numbers or the list
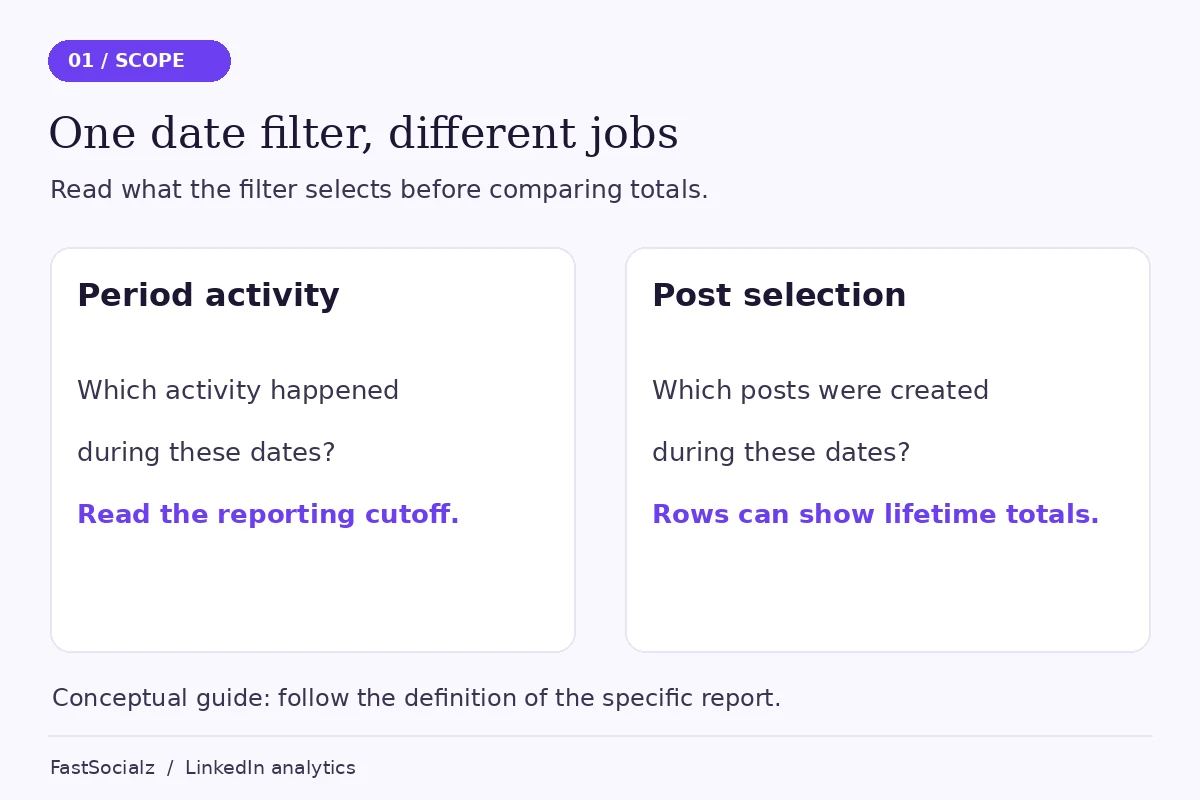
A date control can do two different jobs. It can restrict the activity being counted, or it can restrict which content appears in a list. Those jobs are easy to confuse when both controls look similar.
LinkedIn’s combined post analytics guidance says the full recent-posts table selects content by creation date and shows lifetime metrics. The content-performance graph instead summarizes the selected period. Its graph and top-performing list use complete data through yesterday. The recent-posts table is gradually becoming available on desktop; mobile support is described as coming later.
Those details matter more than the position of a button. If your account doesn’t show that table, use the individual post view and record its scope. Don’t assume your account is faulty because a guide shows a screen you don’t yet have.
A hypothetical date-range example
Suppose you published a hypothetical post at the end of October and it continued attracting attention in November. Selecting November in a list of posts created during November would exclude that post. A report about activity received during November could still have a reason to include activity on older content.
This example explains the distinction between creation and activity dates. It doesn’t claim a particular result for your account or imply that every LinkedIn report uses identical rules.
Practical tip: Give your spreadsheet columns names such as “post created on,” “report period” and “checked at.” A single column labelled “date” leaves too much room for confusion later.
2. Make sure the metric names actually match
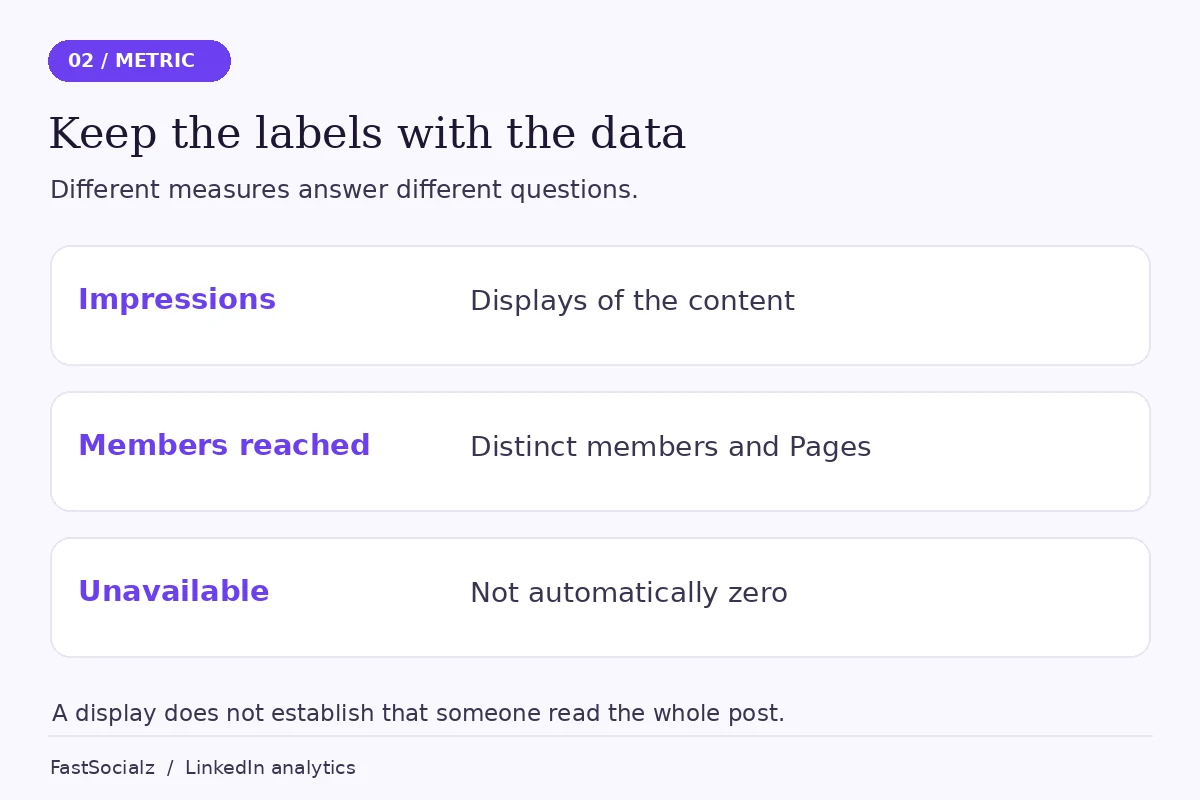
Impressions describe displays. Members reached describes distinct members and Pages, excluding repeat views. LinkedIn describes its analytics figures as estimates. Neither number establishes that someone read the whole piece, understood it or intended to buy from you.
The official individual post analytics definitions are the reference for the labels you see. Copy the full label into your notes instead of shortening several different measures to “views.”
Consider another explicitly hypothetical example: one person encounters the same post more than once. A display count and a distinct-audience count need not increase in the same way. That difference is part of what the metrics mean; it isn’t evidence of duplicate customers or a broken report.
This is also why you should resist adding together unlike measures. Reactions, impressions and profile visits aren’t interchangeable units of attention. A larger combined number can look impressive while becoming harder to interpret.
If your actual concern is that people see posts but don’t investigate your profile, that’s a different question. Our guide to LinkedIn impressions without profile views focuses on that next step rather than reconciling reporting screens.
3. Compare equivalent snapshots, not a screenshot with a moving total
A screenshot is a record of what you saw at a particular time. It isn’t a live connection to the report. When you compare it with a later view, you introduce another difference before considering anything else.
For a useful comparison, record both screens during the same review session. Note the date range, selected metric and the time you checked. If you return later, create a second observation rather than overwriting the first.
You don’t need a complicated reporting system. A short note is enough: “Checked both views at 10:00; selected the same named metric; one view uses lifetime scope.” It helps you distinguish a changing total from a different definition.
Avoid turning this into an invented refresh schedule. The documentation used here doesn’t supply a universal promise that every analytics field updates after a specific number of minutes. “Wait exactly 24 hours and it will match” would be a stronger claim than the evidence supports.
When a report explicitly excludes the current day, respect that cutoff. When its cutoff is unclear, record the uncertainty instead of filling the gap with a guess. Your goal is a comparison you can explain, not a spreadsheet with no blank cells.
4. Separate missing detail from a recorded zero
A missing breakdown can be frustrating, particularly when the headline total is visible. But absence of a breakdown is not automatically absence of activity.
LinkedIn says some audience demographic information depends on having enough unique viewers to protect privacy. It also says demographic data isn’t available for content shared only with connections or within Groups. These are limitations on the detail you can see, not proof that the post received no attention.
In the recent-posts table, a dash indicates a metric that isn’t available for that post type. Keep that distinction when exporting or copying your notes. Replacing every dash with zero makes a clean-looking sheet at the cost of changing its meaning.
For your own records, use a short reason alongside an unavailable value: “not applicable to format,” “not displayed” or “scope not confirmed.” Don’t choose a more specific explanation than the screen or documentation supports.
This approach also keeps you from calculating misleading averages. If three posts have a metric and two don’t, an average that treats the missing two as zero answers a different question. Decide which comparison is valid before calculating it.
5. Check who the post could be shown to
Visibility settings and actual distribution aren’t the same thing. Still, the audience you selected matters when you compare posts or look for audience details.
LinkedIn’s post visibility documentation distinguishes Anyone, Connections only and Group audiences. It says you can’t change that visibility choice after sharing a post. Your selection is saved as the default for the next post, although you can change it before publishing. Scheduled content uses the choice made when it was created.
Check the audience on the original post before using it as a comparison. A deliberately limited update and a public explanation aren’t equivalent publishing decisions. Don’t make a private discussion public just to pursue a larger number.
This check is particularly useful when several people help prepare content. A draft can have appropriate wording but the wrong intended audience. Add an audience check to your publishing routine, alongside links and permissions.
Practical tip: Review the next post’s audience before it goes live. You can improve the next decision without deleting an existing post merely to make a report look tidier.
6. Decide whether the discrepancy changes your next action
Once you understand the numbers, ask what you were trying to decide. Were you choosing a topic, checking a link, assessing audience fit or preparing a monthly report?
For topic selection, the content and quality of reader questions may be more useful than forcing two differently scoped totals to agree. For a monthly report, consistent definitions and periods matter because someone else needs to understand the comparison.
If you’re choosing between a short post and a longer explanation, see our LinkedIn posts-versus-articles comparison. Format is an editorial choice, not a reliable shortcut around measurement uncertainty.
A useful reporting note might say: “These are lifetime figures for posts published during the selected month; they are not activity received only in that month.” That sentence prevents a common misunderstanding without pretending the report answers more than it does.
When to investigate a possible reporting issue
If the metric, content item, reporting scope and observation time are aligned and the discrepancy remains unexplained, collect a small evidence set. Include the post URL, the exact labels, selected filters and screenshots showing the difference. Remove private information before sharing it outside the people who need it.
Describe what you observed rather than announcing a cause. “These two views differ under these settings” is more useful to support than “the algorithm deleted my reach.” This guide cannot diagnose an individual account from its public posts.
A manageable review checklist
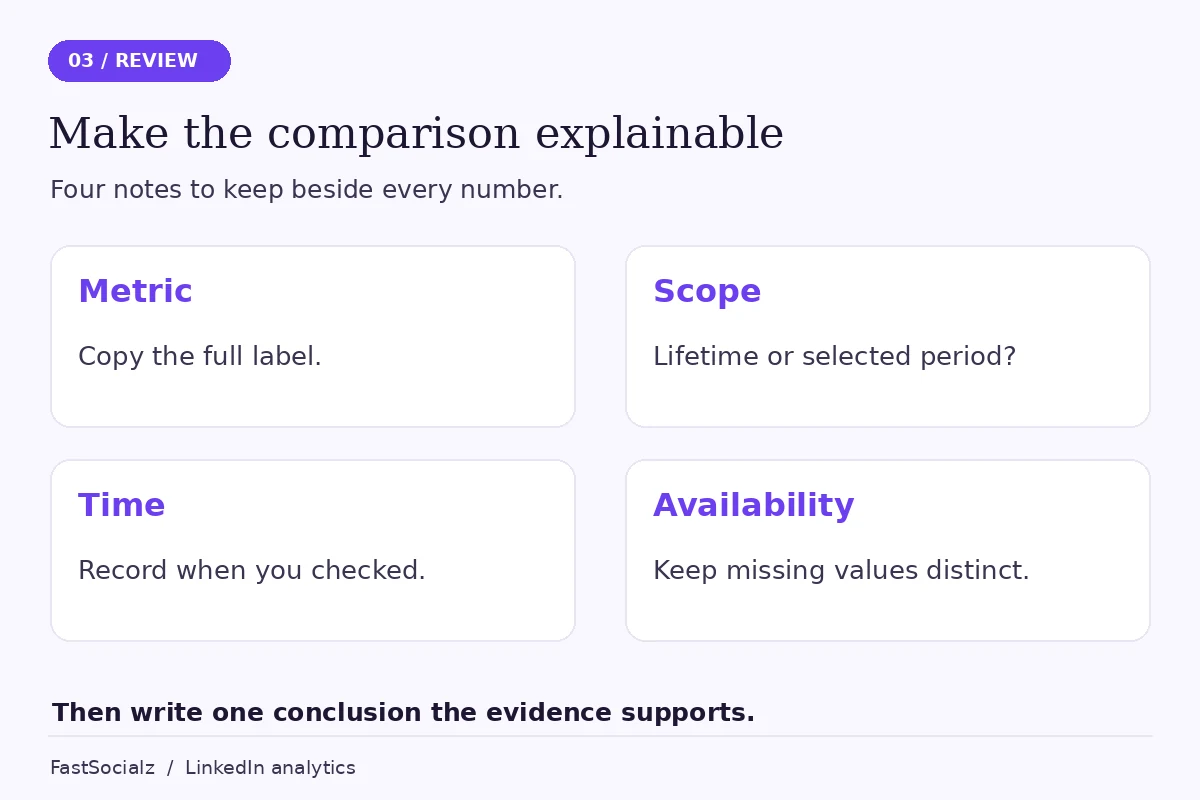
For your next review, work through these six steps:
- Open the original post and identify the metric you need.
- Record its publication date and intended audience.
- Write down whether each report uses lifetime or selected-period figures.
- Align the observation time and respect any stated cutoff.
- Keep unavailable values separate from zero.
- Write one conclusion the evidence supports and one question still unresolved.
Stop there unless an unresolved issue affects a real decision. Rechecking a number repeatedly can consume the time you meant to spend improving the content.
If you’re reviewing your wider presence too, explore FastSocialz’s LinkedIn growth service. Keep that choice separate from this audit: a growth service doesn’t repair analytics definitions or replace useful content and careful measurement.
Frequently asked questions
Why doesn’t the post total change when I change the date range?
In LinkedIn’s recent-posts table, the date range selects posts by creation date and each row shows lifetime metrics. It does not limit that row’s metrics to activity within the selected period.
Does an impression mean someone read the post?
No. An impression describes a display, not completion or understanding. Use the metric for the question it answers rather than treating it as proof of a qualified reader.
Should I enter zero when a metric is unavailable?
No. Keep unavailable values distinct from measured zeroes. Otherwise your totals and averages can imply something the report never said.
Does a mismatch prove my account is restricted?
No. A mismatch alone doesn’t establish an account restriction. First check definitions, scope and time. Investigate any actual account notice separately rather than inferring it from two totals.
Make the comparison explainable
The most useful outcome is not a pair of identical numbers. It’s knowing what each number can tell you, what it leaves out and which decision it can reasonably support.
Keep the labels with the data. Keep the dates with the screenshots. When the scopes differ, explain that difference rather than hiding it with arithmetic.
Written by the FastSocialz Editorial Team. The workflow recommendations are editorial guidance, not an original campaign study. Official sources were checked on 14 November 2026. Browse more LinkedIn guides.